
02 · Training tracking and compliance reporting
Know where to act before you build a report.
Every role gets a dashboard that opens on what it is responsible for: what’s due now, what’s coming up, and who needs attention. Each dashboard is ready the moment it opens.
The problem
The people who most need the information have the least time to become analysts, so the report builder goes unused and decisions get made on instinct.
Compared
What you get elsewhere, and what you get here.
What you get elsewhere
- A report builder, some templates, and a training session on how to use them.
- Directors pulled into analyst work just to confirm what they already suspected.
- Numbers with no owner and no next step.
- Data drawn from separate systems that report conflicting figures.
What you get from Qaliber
- Dashboards that open on what matters to each role, ready from the first login.
- A single status at the top, the number of people who still need attention beside it, and a direct path into the detail behind it.
- Ready-made reports when you want structure, or any report you need from a one-sentence request.
- Reports you can save, share and schedule.
- Every figure comes from one source, kept separate from every other customer’s data, so every department works from the same numbers.
Shown
See it working.
Manager dashboard
Your team, today.
What’s due now, what’s coming up, and how your people are tracking.
Include downline
Introduction to B2B SaaS Sales
Michael Knudsen · Online course due
TodaySales Onboarding: Qaliber Learning Value Proposition
Michael Knudsen · Online course due
Sun, Aug 16What Is Customer Service and Why Does It Matter?
Michael Knudsen · Online course due
Sun, Aug 16Team insight · team + downline
On Track
Everything required is current, and every credential is valid.
0/2 need attentionOpen Insight →
The dashboard assembled it on its own. The dashboard opens on this manager’s team, with the overall status at the top and the number of people who still need attention beside it.
From the product
The screens your team would work in.
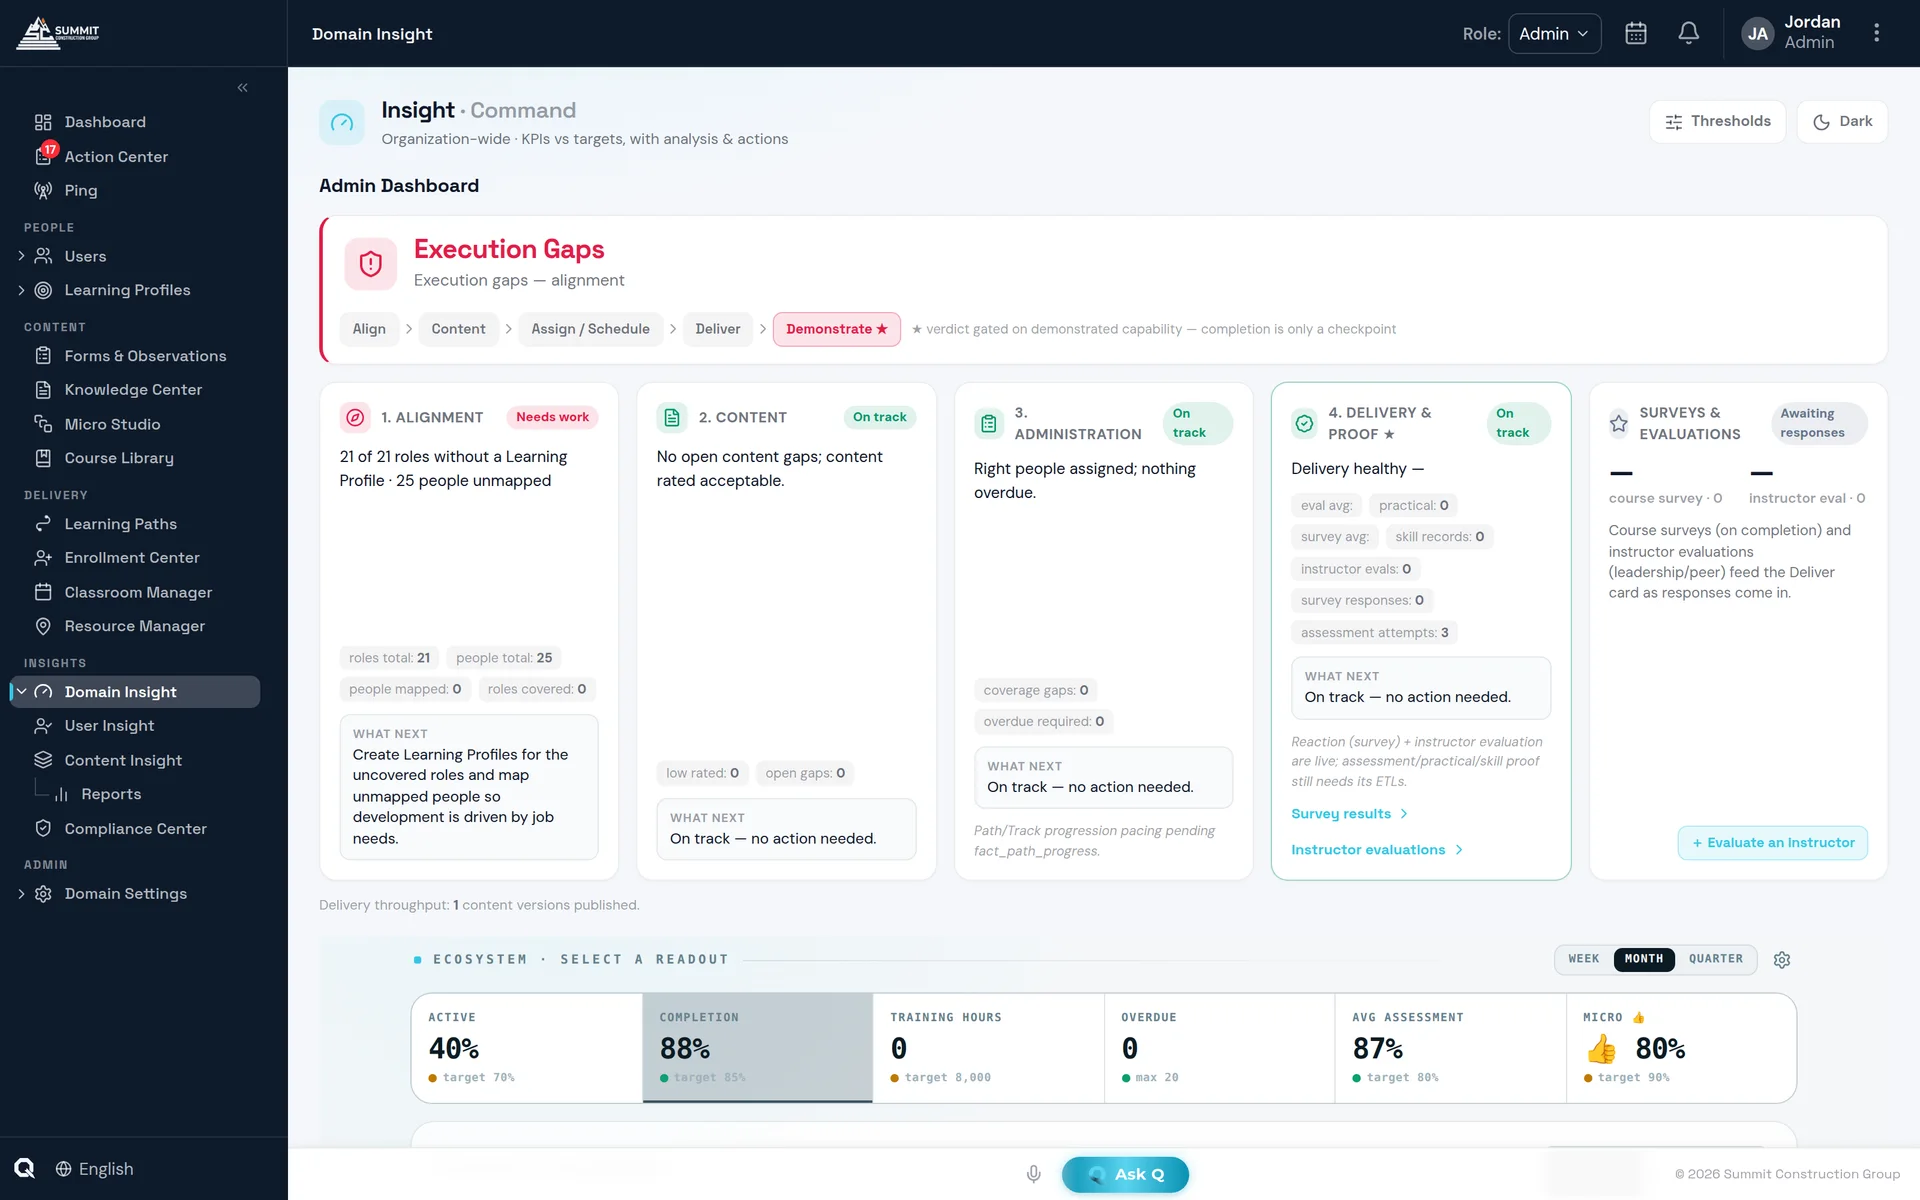
Domain Insight — the top-level view, with each KPI measured against its target.
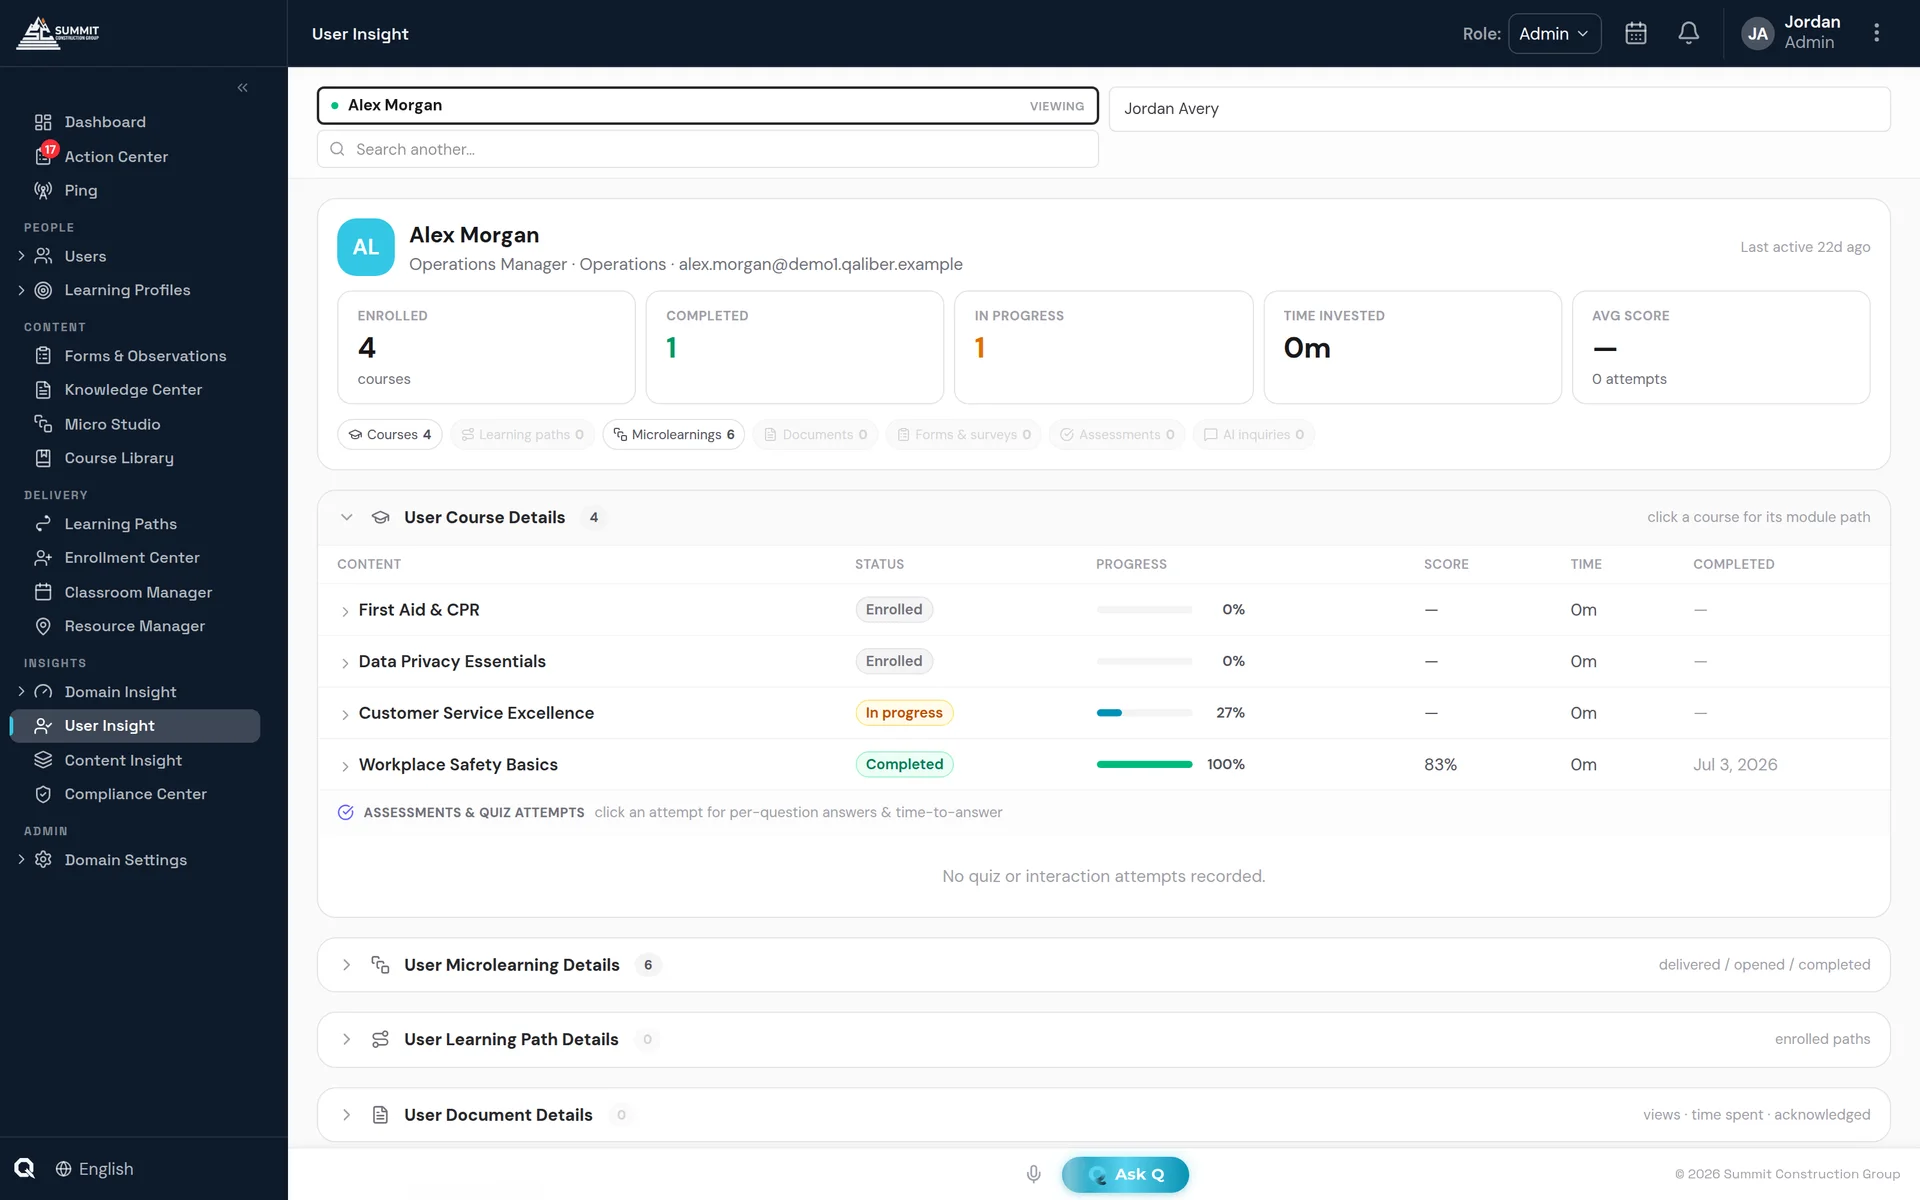
User Insight — the per-person drill-down behind every number.
Included
What's included.
Dashboards ready on day one
Each role’s dashboard opens on what that role is responsible for, so everyone can read it at a glance.
A clear status at a glance
The dashboard opens by showing whether the team is on track and how many people need attention.
Prepared reports or plain-language requests
Use a prepared report when you want structure, or ask for the report you need in a single sentence.
One source for every figure
Every screen draws on the same set of figures, so every department sees the same numbers.
FAQ
Questions buyers ask.
Can reports be scheduled?
Yes. Reports can be delivered on a schedule by email as CSV, Excel or PDF.
Can we connect Power BI or Tableau?
Yes. A read-only data feed connects QaliberLMS to Power BI and Tableau.
Do managers need to build reports to see their team?
No. Each role's dashboard opens on what that role is responsible for: what's due now, what's coming up, and who needs attention.